
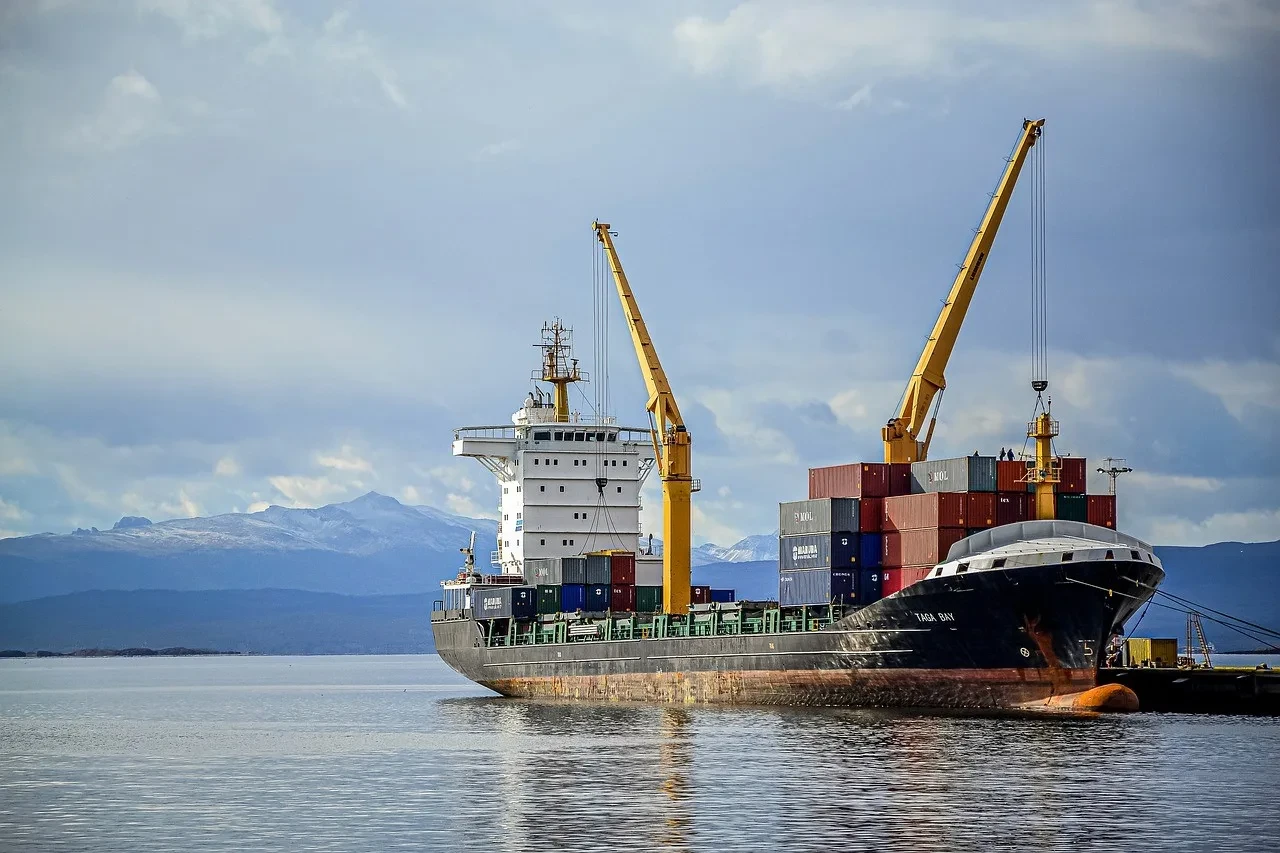
In 2025, multiple import and retaliatory tariffs have been implemented or are due to take effect.
And while it can often be difficult to keep up with the shifting policy landscape, the movement of vessels and cargoes shows that realignment may already be in motion.
Dry Bulk: Echoes of 2018. China May Rebalance Towards Brazil Again
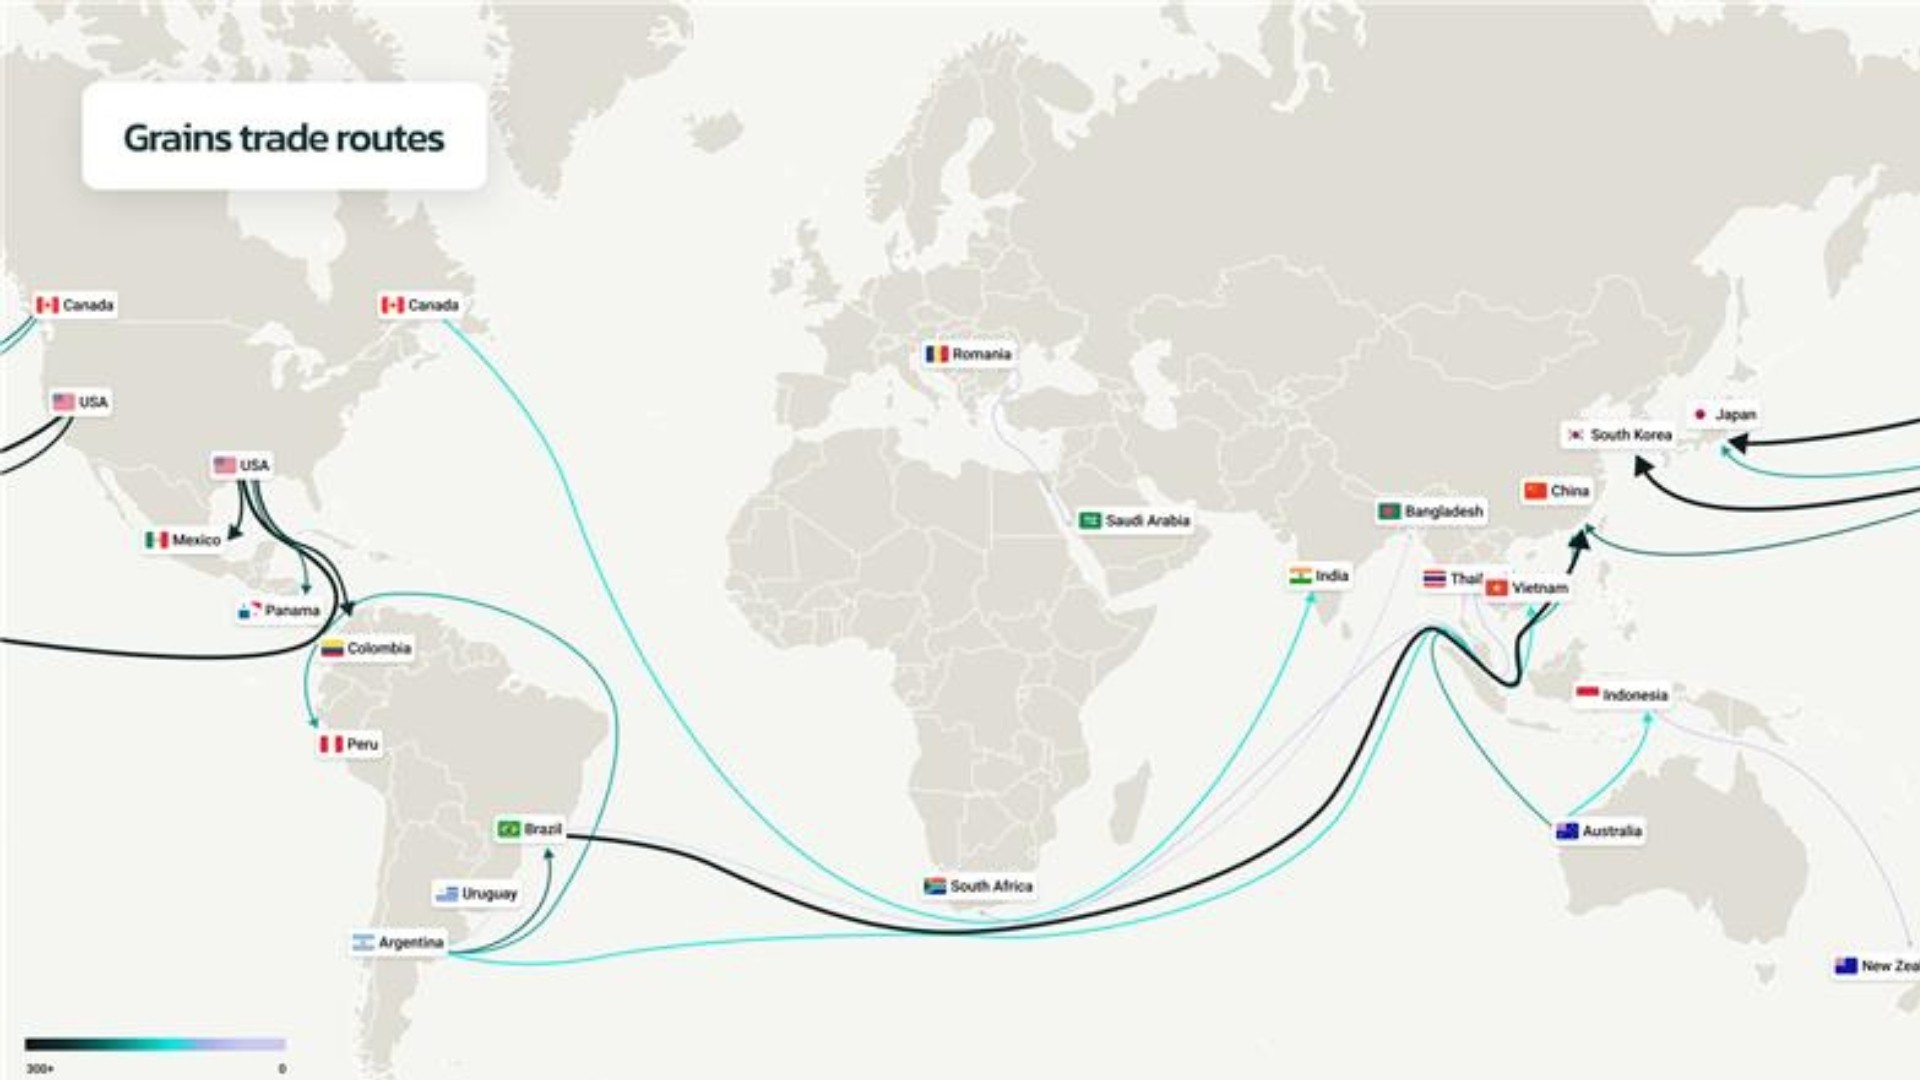
In the agricultural sector, traders are signalling a potential retreat from U.S. grain exports to China, with Brazilian volumes once again on the rise.
This mirrors what occurred in 2018 when retaliatory tariffs pushed dry bulk flows away from traditional US-China lanes.
Marcura’s trade data on grain shipments to China supports this possible trajectory.
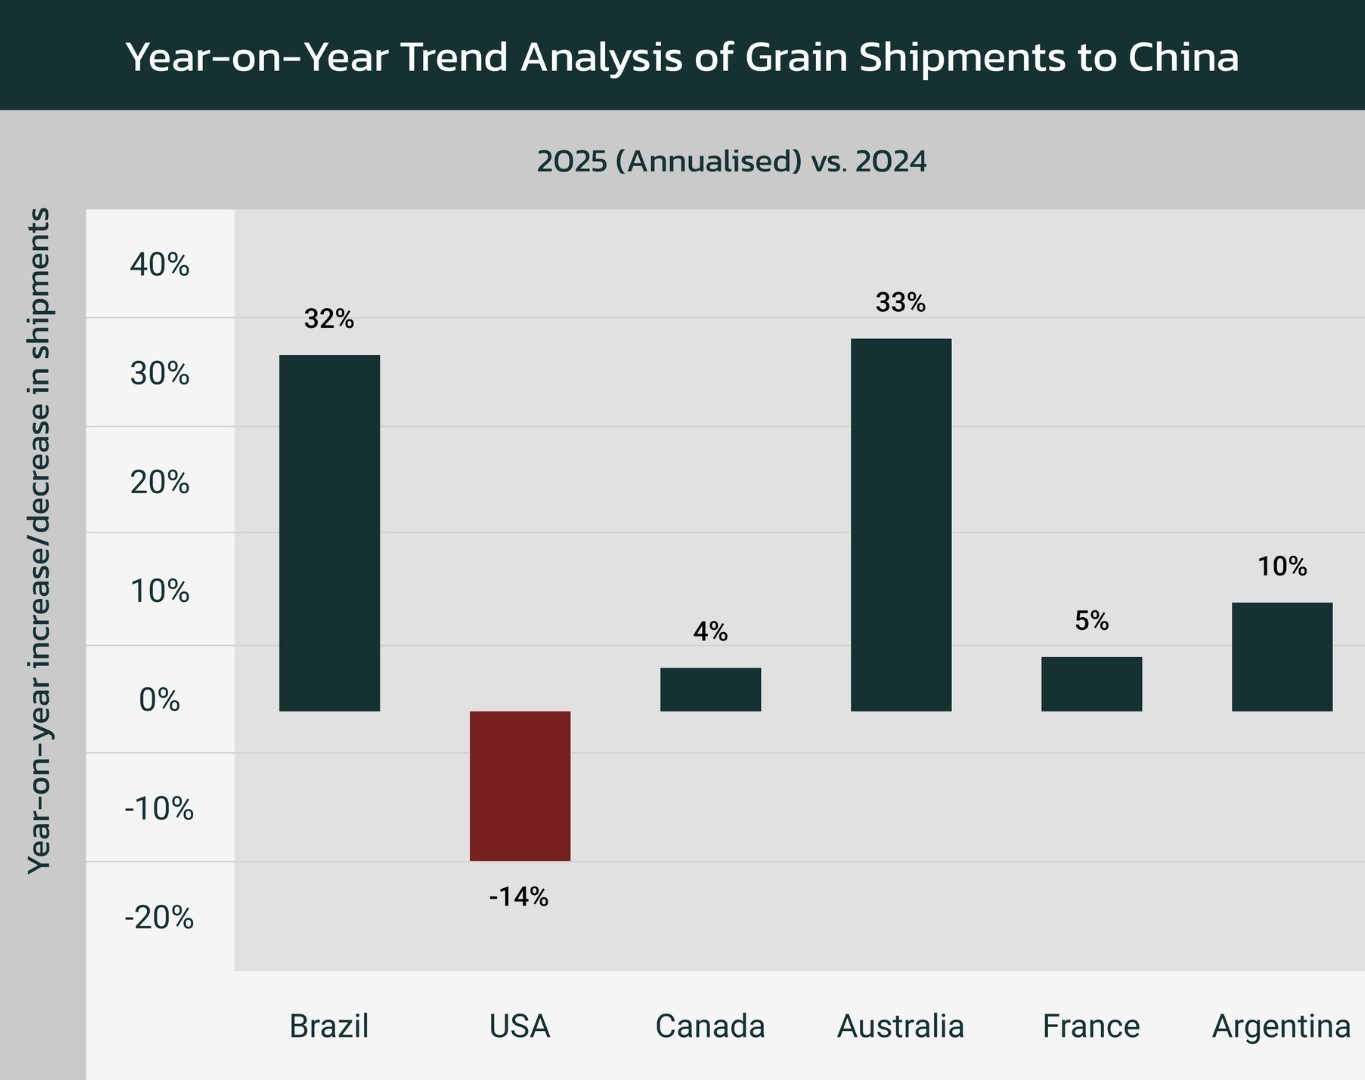
While China continues to import grains from the US, Brazil’s share has grown steadily, with annualised 2025 data showing a sharp rise in activity. Grain shipments from Australia into China are showing similar levels of growth.
This shift, though still fluid, suggests that if tariffs persist, the trade rebalancing of 2018 could reappear, reinforcing Brazil as a key dry bulk origin.
Crude Oil: Alternative Supply Channels Under Formation
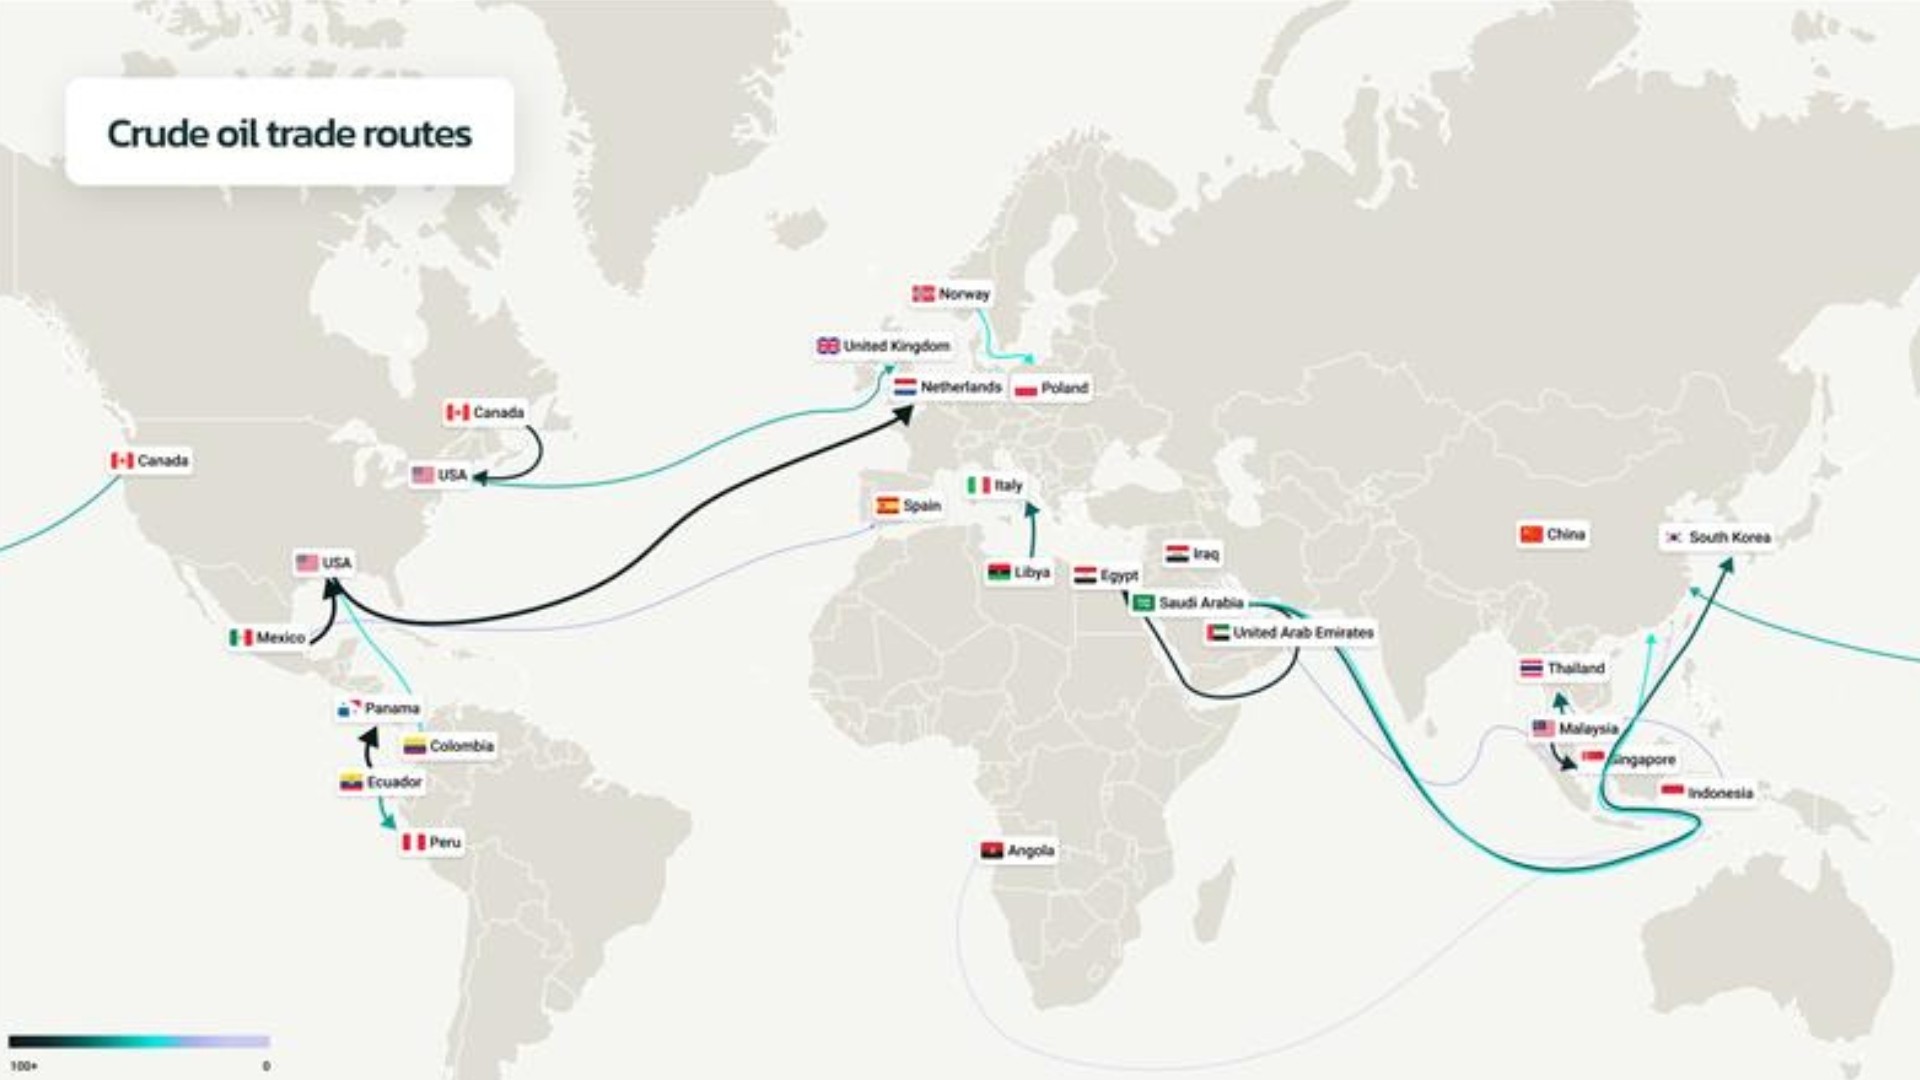
In the crude oil segment, a measured diversification in US sourcing is underway.
Although Canada and Mexico have traditionally dominated, recent trends suggest a growing role for producers such as Brazil, especially along the US West Coast.
Marcura’s dashboard shows that crude volumes from these alternative origins are gaining traction.
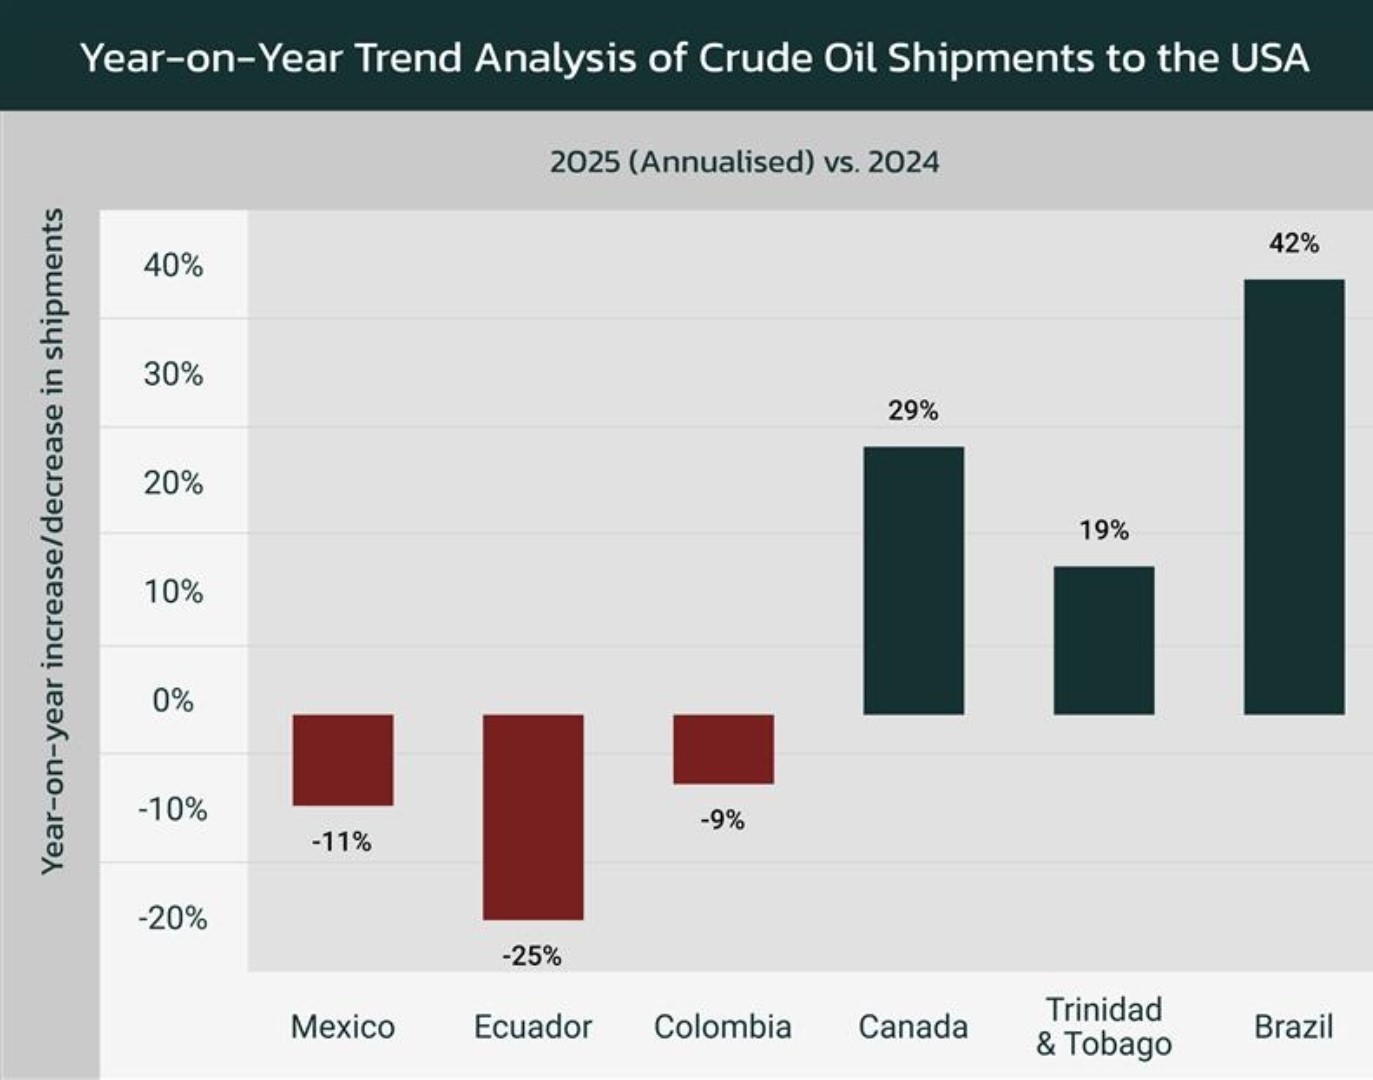
While the overarching data presents a relatively mixed picture, the pattern emerging is suggestive of a shift toward building supply resilience in response to cost, political risk, and future tariff exposure.
Make the right call with Marcura
Trade data doesn’t wait for headlines. Even before new tariffs fully ripple through pricing or official trade stats, the early signals are already visible.
These signals are easy to miss if you’re relying on lagging indicators. But at Marcura, our platform surfaces them in real time, offering a clearer view of what’s happening now, and where trade flows are headed next.
Get in touch to learn more on how Marcura can help you remain agile to changing market conditions
Book a demo