In this report
Reasonable versus defensible: Why owners can’t verify their costs are fair, and why managers can’t prove they are.
Where costs leak: Where costs leak across the port call lifecycle, from planning to settlement, and at which point it’s too late to act.
Data before you commit: What changes when cost data enters the process before you commit, not after the FDA arrives.
A benchmark at the PDA: How to have a benchmark in hand before you approve a PDA, not after the damage is done.
One bulker fleet’s shift: How one bulker fleet operator moved from fragmented email workflows to full cash flow control.
Marcura's 2026 guide makes a pointed case about husbandry costs. It calls husbandry neither the largest nor the most visible cost line in vessel OPEX, but arguably the least controlled. The issue, it argues, is rarely the absolute cost. The problem is timing: every disbursement account holds the data, but it is reviewed after the decisions it could have shaped.
~195,000
non-commercial port calls a year
3x
typical proforma-to-final cost gap
80%
of husbandry workflows still on email
Figures from Husbandry, the most overlooked lever in vessel OPEX (Marcura, 2026).
What are husbandry costs?
In our definition, husbandry costs are what a vessel spends on services for its own needs rather than for cargo handling. Crew changes, stores and medical arrangements are typical examples. Marcura’s guide puts the number of non-commercial port calls across the industry at around 195,000 a year, managed largely through third-party ship managers.
In the guide’s account, the costs flowing through each call are fragmented across ports, agents and invoices. They are then processed through manual, time-pressured workflows. For owners, the guide says, that means limited ability to benchmark whether costs are competitive. For managers, it means difficult conversations about disbursement account details. It puts the share of husbandry workflows “still managed through fragmented email chains” at 80%.
How is husbandry spend split by service type?
Crew change costs are the largest line in the guide’s typical husbandry cost distribution by service type, at 32%. Stores and spares follow at 24%. The table gives all six shares.
Typical husbandry cost distribution by service type, as the guide gives it
Service type | Share |
|---|---|
Crew changes | 32% |
Stores & spares | 24% |
Cash to master | 14% |
Medical arrangements | 12% |
Permits & authorities | 10% |
Other | 8% |
Can owners and managers tell whether husbandry costs are fair?
Marcura’s guide frames the tension over husbandry costs as two questions. As an owner, “are you paying the right costs for your husbandry port calls?” As a manager, “how do you prove you are getting a fair price?” In many cases, the guide says, neither side has the visibility to answer either question with confidence.
Owners pay the costs, the guide says. Managers are accountable for how those costs are incurred and reported. “The core problem is not process,” it adds. “It is the absence of structured, comparable data at the moment decisions are made.”
Service definitions vary between agents, in the guide’s account, making quotations impossible to compare meaningfully. Scope is rarely defined before agents are engaged. Most teams, it adds, have no comparable cost data when committing to an agent. Our post on why it’s time to rethink how you manage husbandry looks at how one port call can draw in several departments and agents.
Reasonable versus defensible
When owners question costs, the guide says, they are asking whether the number is competitive. When managers struggle to answer, “it is not because the decision was wrong. It is because the process left no comparable reference point to defend it with.” That gap, between a reasonable decision and a defensible one, is in its words “where the friction lives”.
What is the difference between a PDA and an FDA?
In our terms, a proforma disbursement account (PDA) is a port agent’s estimate of a call’s costs, issued before the call. A final disbursement account (FDA) records what the call actually cost and is issued after it. Marcura’s guide notes: “There is no reliable market benchmark when committing to a PDA.” By the time the FDA arrives, it says, the opportunity to influence cost has already passed.
The guide puts the typical gap between proforma and final disbursement accounts at 3x, under the label “Cost variance”.
The data itself is not missing. “The data exists. Every PDA and FDA contains it,” the guide says. “The problem is timing.” By the time the data is reviewed, the decisions it could have influenced have already been made.
Our article on what it takes to approve a disbursement account covers the review in practice. For the wider process, see port cost management and disbursement accounts.
Where do husbandry costs leak across the port call lifecycle?
Marcura’s guide maps husbandry cost leakage across five stages of a port call: planning, scoping, procurement, execution and settlement. Its chart shows uncontrolled leakage at 20% in planning, 40% in scoping, 45% in procurement, 60% in execution and 50% in settlement. The rest of each bar is shown as controlled spend. Each bar appears to be its own whole, so the five figures don’t add up to 100.
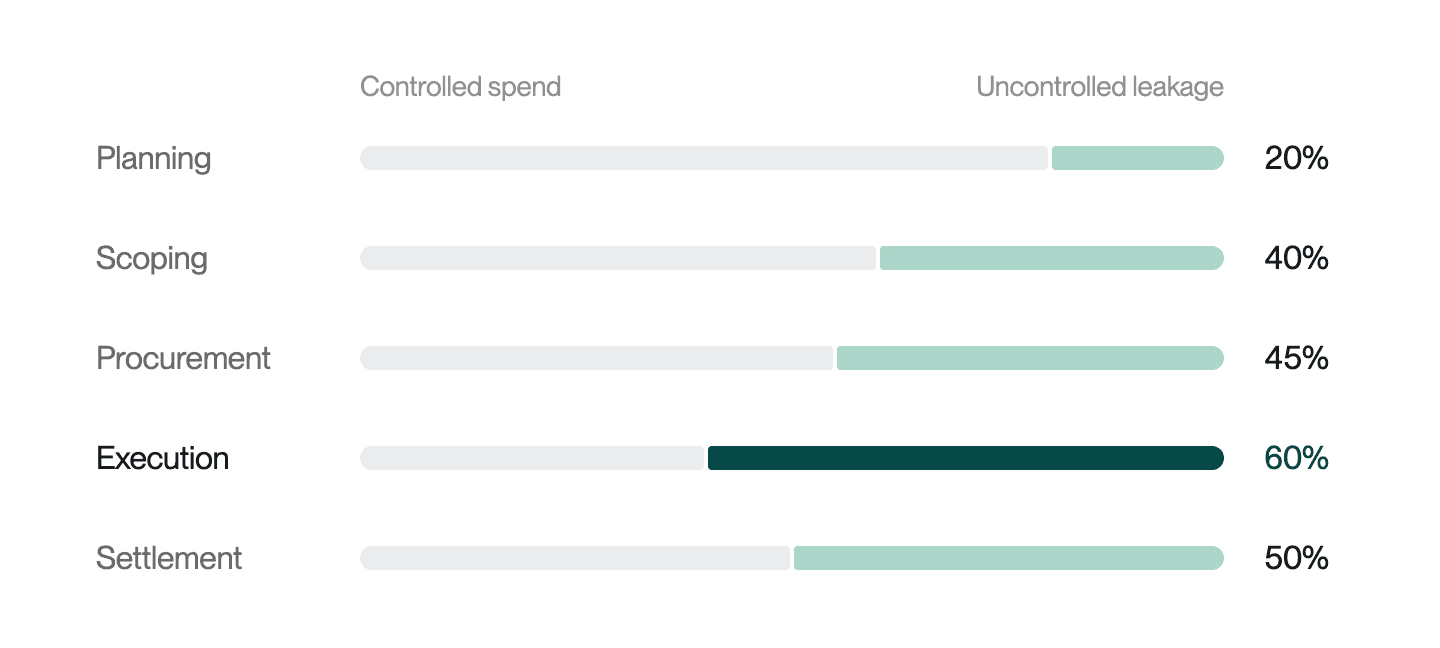
In the guide's chart, uncontrolled leakage is lowest at planning and highest at execution, based on industry interviews and disbursement account analysis.
“The problem builds across the full lifecycle,” the guide says. “By the time planning begins, port selection is often already constrained. By the time scoping happens, agents are already engaged. By the time variances are visible, settlement is approaching.” It adds: “None of this is a failure of expertise. It is an absence of decision support.”
What does commercial control of a husbandry port call look like?
Marcura’s guide describes a shift from reactive coordination to commercial control. It contrasts a “Reactive today” list with a “Controlled future” list. In the first, an agent is engaged before scope is defined and decisions rely on experience alone. In the second, standardised requests for quotation (RFQs) enable comparison and benchmarks are surfaced at the point of decision.
The guide prints the two lists separately. The table sets them side by side in printed order.
The guide's two lists, side by side
Reactive today | Controlled future |
|---|---|
Agent engaged before scope is defined | Planning begins at vessel level, pre-port |
Quotations in inconsistent formats | Standardised RFQs enable comparison |
No like-for-like comparison possible | Benchmarks surfaced at point of decision |
Variances discovered post-execution | Real-time visibility into cost development |
Benchmarking is a separate, periodic exercise | Benchmarking embedded in every workflow |
Decisions rely on experience alone | Every decision supported by structured data |
Why does Marcura’s guide tie defensible husbandry costs to benchmarking?
Marcura’s guide ties defensible husbandry costs to benchmarking at the point of decision. It describes a gap between a reasonable decision and a defensible one. Without that benchmarking, it says, the friction in that gap “does not go away. It just gets managed retrospectively, one difficult conversation at a time.”
“Husbandry disbursements will never be as standardised as bunkers,” the guide says. “They do not need to be opaque either.” With structured workflows, forward-looking planning and reliable benchmarking, it argues, they become “a defensible cost area”, one where decisions can be explained and justified. For the how, the guide presents Marcura’s husbandry platform.
On page 8, the guide returns to the owner’s and the manager’s questions. “The gap between those two questions,” it says, “is where better data, better processes and better relationships are built.”

About this guide
Marcura published Husbandry, the most overlooked lever in vessel OPEX, a 9-page guide, in 2026. It sets out where husbandry costs leak across the port call lifecycle and what commercial control of a port call looks like. Its lifecycle chart is based on “industry interviews and disbursement account analysis”.
On page 8, the guide says its benchmarks “come from one of the industry’s largest datasets of husbandry transactions”. It says the data spans ports, agents, vessel types and service categories. Beside that, it prints three figures: 25,000 port calls annually, $250M+ in analysed port expenditure and 11,000+ vessels across all major maritime hubs.
The definitions of husbandry costs, husbandry port calls, PDAs and FDAs in this article are ours.
Marcura publishes both the guide and this article. The guide’s later pages present Marcura’s husbandry platform. This summary leaves that material out.
FAQs
Related resources